🧬 Chemical Z & T Cell Cycle Regulation
AP Biology Free-Response Question — Student Response Form
📌 Examination instructions: Read each question carefully. Write your response in the space provided for each part.
Answers must be written out in paragraph form. Outlines, bulleted lists, or diagrams alone are not acceptable and will not be scored.
Use the figures below to answer all parts (a) through (d). An answer key will be uploaded separately for auto‑marking.
📊 Figure 1: Cell cycle model & chemical block points
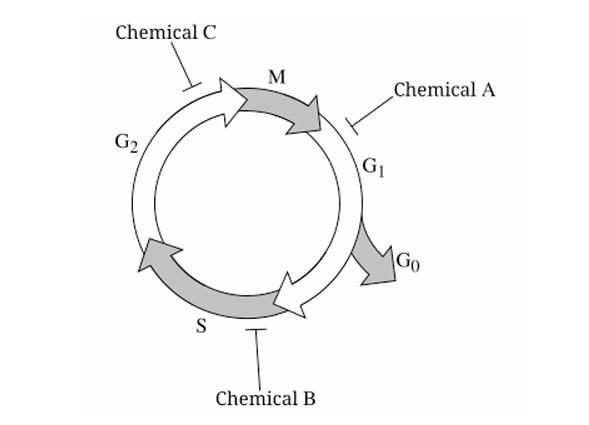
🔬 Figure 1: Chemical A blocks at G₁/S checkpoint, Chemical B arrests cells during S phase, Chemical C blocks at G₂/M transition.
📈 Figure 2: Percent of T cells in each interphase phase
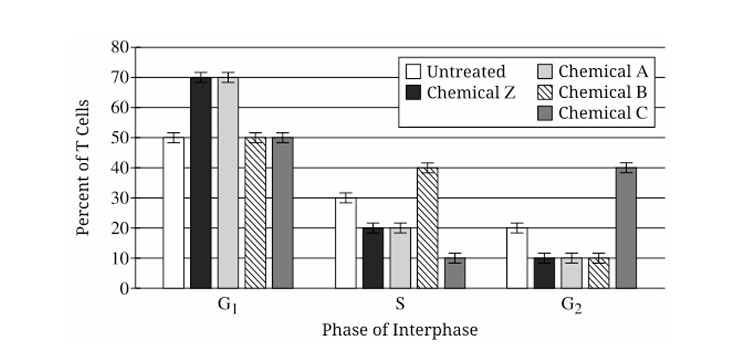
📊 Figure 2: Percent of cells in G₁, S, and G₂ measured by flow cytometry.
💡 Untreated = normal cycling T cells. Chemicals A, B, C are known cell‑cycle blockers (controls). Chemical Z is experimental.
a
Membrane transport & DNA content indication paragraph required
Chemical Z is a large, polar molecule. Describe the process by which chemical Z moves across the plasma membrane without an input of cellular energy.
Explain why the amount of DNA in a cell indicates whether the cell is in G₁, S, or G₂.
✔️ Paragraph form only. No bullet points or outlines.
b
Variables, controls & justification paragraph required
Identify a dependent variable in the experiment. Justify the use of untreated cells in the experiment.
Justify the use of both chemicals B and C in the experiment.
✔️ Write in complete sentences.
c
Data interpretation & calculation paragraph + computation
Based on the data in Figure 2, identify the phase in interphase at which chemical Z treatment blocks the cell cycle.
Describe the trends in the data that support your identification.
Based on the mean values shown in Figure 2, calculate the difference in the number of cells in G₁ between the sample treated with chemical Z and the untreated sample if a total of 600 cells are counted for each sample. Show your work within your paragraph.
Based on the mean values shown in Figure 2, calculate the difference in the number of cells in G₁ between the sample treated with chemical Z and the untreated sample if a total of 600 cells are counted for each sample. Show your work within your paragraph.
📐 Refer directly to the percentages in Figure 2. Show calculations.
d
Null hypothesis & clinical reasoning paragraph required
Cancerous T cells result from genetic mutations and lack normal cell cycle controls. Scientists tested whether chemical Z blocks the cell cycle of cancerous T cells.
State the null hypothesis for their experiment.
Individuals with cancerous T cells also have normal T cells. Scientists find that chemical Z is an effective treatment against cancerous T cells. However, they claim that using chemical Z can have a negative effect on a patient's ability to fight off an infection. Provide reasoning to justify their claim.
Individuals with cancerous T cells also have normal T cells. Scientists find that chemical Z is an effective treatment against cancerous T cells. However, they claim that using chemical Z can have a negative effect on a patient's ability to fight off an infection. Provide reasoning to justify their claim.
🔬 Provide a clear null hypothesis and mechanistic reasoning.